Trading ES Futures: Fair Value, the Session Clock and the Auction
What an ES point is worth, why a future is nearly a line and an option a curve, fair value, when ES volume trades, how the open frames the auction, and sizing.
Key takeaways
- An ES contract is the S&P 500 times $50: a quarter-point tick is $12.50, and at an index of 6,000 one contract controls $300,000. Size a position from the stop in points, not from the margin the broker asks for.
- ES is not the SPX plus a fixed number. The futures carry interest minus dividends until expiry, so the premium shrinks to zero over the quarter. To read the index from overnight futures, subtract fair value, not yesterday's closing gap.
- Continuous charts hide the roll. Around expiry week the volume moves to the next quarter, and a chart that splices or adds the two contracts can show volume and opens that never traded.
- About four fifths of a session's ES volume trades in the six and a half cash hours, with roughly a tenth in each of the first and last half hours. Overnight ranges are made on thin volume, and any volume reading should be compared with the same time of day.
- Where the market opens against yesterday's value area and range frames the first hour: balance, a test of value, or a search for new prices. Acceptance, not a touch, is what changes the day.
- The S&P 500 index has no volume of its own. Volume at a price can be borrowed from futures; who was the aggressor cannot, and a small net delta is often noise.
- A futures rule is judged by its result after costs, not its hit rate. Sixty percent winners after ten trades says almost nothing.
- A future is close to a straight line: every point is worth the same, with a small curve from daily settlement and interest. An option is a curve, and the curve is why options positioning shows up in futures. The option holder pays rent every day and needs the market to move more than it priced.
- A margin call does not stop at the maintenance level. The broker asks you to bring the account back to the initial margin, or it closes the position.
- Volume is not liquidity. Volume with open interest says whether positions are being opened or closed, and heavy volume with no progress is a warning, not a confirmation.
- Plan the session before the open, decide the exit before the entry, size from the worst fill you allow, and set a daily loss limit you do not move.
What you are trading when you trade ES
The E-mini S&P 500 future, ticker ES, is a cash-settled contract on the S&P 500 index. It is the most traded way to hold or hedge the US stock market outside the cash session, and it is where much of the hedging of SPX options happens. The Micro E-mini, MES, is the same contract at one tenth the size.
| ES (E-mini) | MES (Micro E-mini) | |
|---|---|---|
| Contract size | $50 x the S&P 500 | $5 x the S&P 500 |
| Minimum tick | 0.25 points = $12.50 | 0.25 points = $1.25 |
| One full point | $50 | $5 |
| Value at an index of 6,000 | $300,000 | $30,000 |
| Trading hours (New York time) | Sunday to Friday, 18:00 to 17:00 the next day, with a daily break from 17:00 to 18:00 and a short halt after the cash close | |
| Expiries | March, June, September and December (codes H, M, U, Z), cash settled on the third Friday at the index's special opening quotation | |
Two things follow from the table. The first is that ES is a large contract: a 20-point move, an ordinary hour on many days, is $1,000 per contract. The second is that the futures session and the stock market session are different days. A futures session starts at 18:00 the evening before and runs nearly 23 hours, while the index itself only exists from 09:30 to 16:00. Most of what confuses new futures traders comes from those two facts.
The Nasdaq contract, NQ, is often traded beside ES, and it is a bigger risk than it looks. It pays $20 a point, but the Nasdaq 100 sits at a much higher index level, so one NQ controls more money than one ES. It is also more volatile, because the index is concentrated in a few sectors. Together that means roughly twice the dollar swing per contract. A stop that suits ES in points is too tight for NQ, and a stop that suits NQ in points is a larger loss in dollars. The micro contracts, MES at $5 a point and MNQ at $2, exist for exactly this reason.
A straight line and a curve: why futures sit under the options market
On the price move alone, a future is linear. If the index rises one point, a long ES position makes one point, whether it is the first point of the move or the fortieth, so there is nothing to adjust as price moves. A short position is the same line, upside down. It is not perfectly linear: because futures are settled in cash every day, a future has a small convexity of its own, shown in the second chart below. Next to an option's curve it is tiny.
An option is not. A call gains slowly at first and faster as the market rises; its exposure to the index grows as price moves toward and past the strike, and shrinks as price moves away. That changing exposure is gamma, and it is the whole reason an option behaves differently from a future.
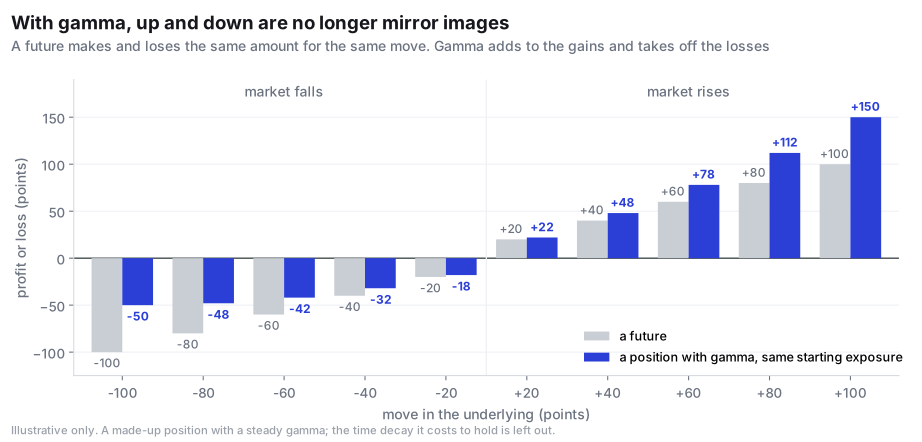
The curve is not free. The buyer of an option pays for it through time decay, a little every day, like rent. The holder only comes out ahead if the market actually moves more than the option price assumed. The seller collects the rent and loses if the market moves more. In other words, an option is a bet on how much the market will move compared with what was priced in, and the passing of time and the size of the moves are two sides of the same bet.
This is where futures come in. Dealers who are long or short that curve keep their exposure in check by trading a nearly linear product against it, and for SPX options that product is mostly ES. When the curve bends, the hedge has to change, and those adjustments are trades in the futures market. A futures trader who ignores the options market is ignoring one of the largest sources of flow in the contract.
Where a future's curve comes from
A future does have some convexity, just far less than an option. A forward contract, agreed privately between two parties, pays once at the end, so its payoff is a clean straight line. Its price already includes interest, and interest already includes the inflation the market expects. If inflation turns out higher than expected, the same nominal gain buys less, and in real terms the line bends slightly against you.
A future is settled every day instead, and that adds a small curve of its own. A gain is paid into the account the same evening and starts earning interest the next day. A loss leaves the account the same evening and stops earning. So the true result of a futures trade is the price move plus the interest on the cash that has changed hands along the way. If rates never moved, that interest would simply grow with the move, and the result would still be a straight line. But rates move with the market. When they tend to rise as stocks rise, a gain earns interest at a higher rate and a loss gives up interest at a lower one, so the result bends upward on both sides: that is convexity. When rates tend to fall as stocks rise, it bends the other way. Borrowing on margin bends the losing side down further, because a broker charges more on a shortfall than it pays on cash.
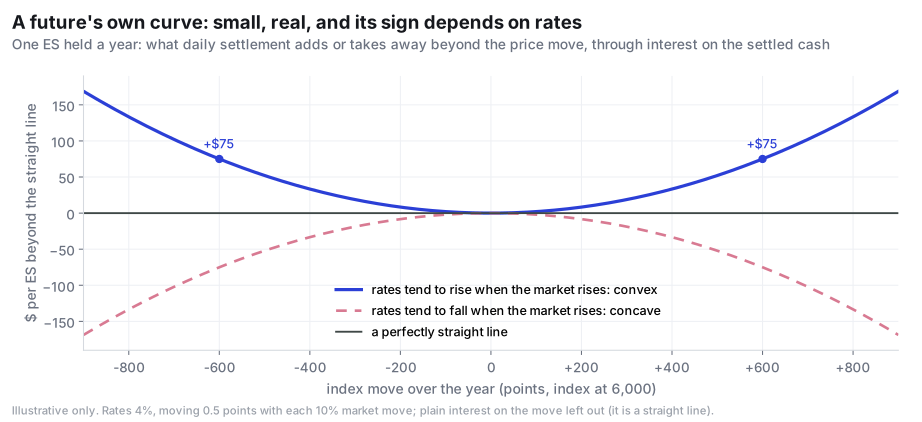
For a day trader this is invisible. For large positions held for months it is worth counting, and it is one more reason the cost of a position is more than its price move.
Points, not percentages: sizing an ES position
Margin is the deposit the broker holds against losses. It is not a measure of risk, and it says nothing about how much you can lose in a session. The initial margin is what you need to open a position; the maintenance margin is the lower level below which the broker asks for more money or closes the position. Both change with volatility and differ between brokers, so check the current figures rather than any number you read in an article.
Futures are settled every day. At the end of each session the exchange takes the day's losses out of the losing accounts and pays them into the winning ones, so nobody carries an unpaid debt overnight. That is what lets two strangers trade with each other: the clearinghouse stands in the middle. It also means a losing position hits your cash the same evening, not when you close it. And when an account falls below the maintenance margin, the call is to bring it back up to the initial margin, not just to the maintenance level. The gap is larger than many new traders expect. Exchanges also set daily price limits and reject quotes far from the market, so in an extreme move trading can pause.
The useful unit is the point. Decide where the trade is wrong, measure the distance in points, and multiply:
risk per contract = stop distance in points x $50 (ES) or x $5 (MES), plus costs
A 12-point stop costs $600 per ES and $60 per MES before fees and slippage. If the most you are willing to lose on one idea is $300, ES is too large for that stop and five MES contracts fit. This is where the micro contract earns its place: it turns sizing from a choice between zero and one into a real decision.
Leverage is the other side of the same arithmetic. A deposit of a few percent of the contract's value controls all of it, so a move of a few percent in the index can equal the whole deposit. Futures losses are not limited to what is in the account.
ES is not SPX plus a constant: fair value and the basis
Buying ES instead of the 500 stocks saves you the cash today, so the future is priced as if you had kept that cash in the bank. You also give up the dividends the stocks would pay before expiry. The difference between the two is the futures premium, called fair value:
fair value premium = index x (interest rate - dividend yield) x days to expiry / 365
With the index at 6,000, rates at 4% and dividends at 1.3%, a contract 90 days from expiry should trade about 40 points above the index. With rates at 3%, about 25 points. As the days run down, the premium shrinks toward zero, and at expiry the future settles to the index itself.
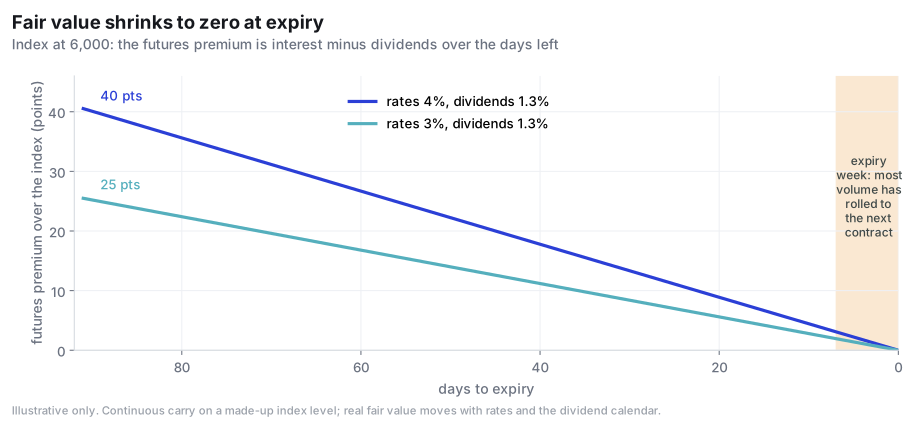
Fair value is held in place by arbitrage. If ES trades too far above it, arbitrage traders short the contract and buy the shares underneath it; too far below, they buy the future and sell the stocks. Selling 500 stocks short is slower and more expensive than buying them, so ES can drift further below fair value than above it before anyone steps in. Small premiums and discounts to fair value are mostly noise. They only mean something when they persist and other flows agree.
This matters most overnight. When the cash market is closed, traders want to know where the index would be, and the natural shortcut is to take yesterday's gap between ES and the SPX close and subtract it from the current ES price. That shortcut carries noise. The index's close is set by the closing auctions of 500 stocks, while ES keeps trading after 16:00, so the two closing prints are not one simultaneous snapshot, and a chart's ES "close" is often a later trade. A gap read from two closing prints can be off by several points. Fair value is the better translation: the current ES price less the carry is the index price that the futures are implying, and that is the number to compare with yesterday's close.
The premium also explains why an ES chart and an SPX chart of the same day do not line up point for point, and why a level drawn on one must be translated before it is placed on the other.
The roll, and what it does to your chart
Each quarter the front contract approaches expiry and traders move to the next one. CME lists the Monday of expiration week as the roll date for US equity index futures, and in practice most of the volume has moved to the next quarter in the days around it. The old contract keeps trading until it settles on the third Friday morning, but it is no longer where the market is.
Most charting platforms show a continuous series that switches from one contract to the next. That is convenient, and it hides three problems a futures trader should know about:
- A price jump at the switch. The next contract trades at a higher premium than the expiring one, because it has three more months of carry. An unadjusted continuous chart shows that difference as a gap that nobody traded. A back-adjusted chart removes the gap by shifting all the history, which means its old prices are no longer prices that traded.
- Volume counted twice. In roll week both contracts trade heavily. A series that adds them together can show up to about two and a half times the volume the front contract actually traded, which distorts any comparison with normal days.
- Opens that never happened. Daily bars from some continuous series stamp the open at a different time from the session's real first trade. A weekend gap measured on those bars can even have the wrong sign. For gap studies, use intraday bars or the index's own open, and leave roll weeks out.
None of this is exotic. It is the most common reason two traders looking at "the same" ES chart disagree about what happened.
Near expiry a trader has three choices: close the position, let it settle in cash, or roll it into the next quarter. A roll is best done as one calendar spread order, which closes the old contract and opens the new one in a single trade, rather than two separate orders that can each fill at a worse price. And whatever you do, use the same dated contract for your chart, your levels and your orders.
The session clock: where ES volume actually trades
A futures session is nearly 23 hours long, but it is not 23 equal hours. We measured the median share of each session's ES volume by half hour over 37 sessions this autumn:
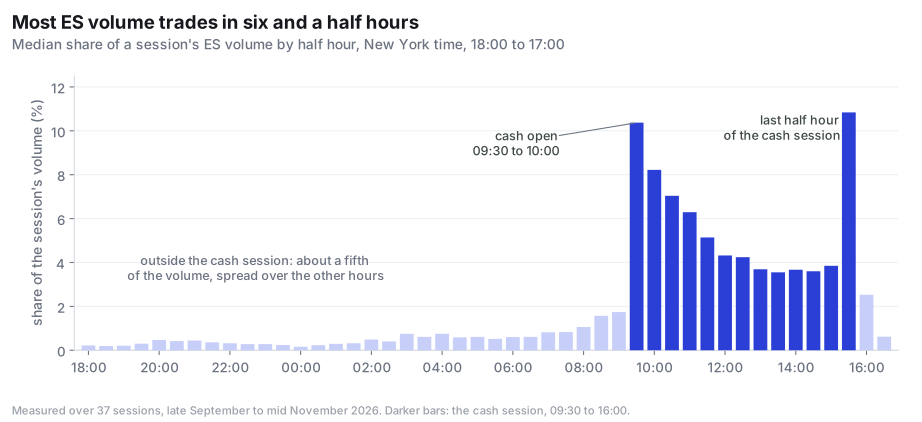
Three practical points follow.
- Overnight ranges are made on thin volume. A high or low set at 03:00 was built by a small fraction of the day's participants. It is a real reference, and price often tests it after the open, but it carries less weight than a level the full market traded through.
- Compare volume with the same time of day. Ten thousand contracts in a half hour is heavy at 13:00 and light at 09:30. Relative volume, today's volume divided by the usual volume for the same slot, is the honest comparison. A breakout on low relative volume is a different event from one on high relative volume.
- Scheduled news moves the clock. Many US data releases come out at 08:30, before the cash open, and the bars around them carry more volume than the hours on either side. On those days the morning can do much of its work before the stock market opens.
Reading the auction: value area, point of control and the open
A volume profile turns a session on its side: how much volume traded at each price instead of in each minute. The price with the most volume is the point of control. The value area is the band around it that holds 70% of the session's volume, bounded by the value area high and low. These come from market profile, the auction framework developed at the Chicago Board of Trade in the 1980s, and they describe one thing: where the market agreed to do business.
Start before the open, with a short written plan for the session: yesterday's high, low and close, and which of the high and low came last; yesterday's value area and point of control; the overnight high and low; the gap; the day's scheduled releases; and the weekly and monthly references nearby. Then write the test the market is most likely to make, the alternative, and what would prove each one wrong. Keep that plan apart from the record of what you actually did: one is the intention, the other is the evidence, and comparing them is how you learn.
The most useful moment to use yesterday's profile is the open. Where today begins, relative to yesterday's value and range, frames what the first hour is testing.
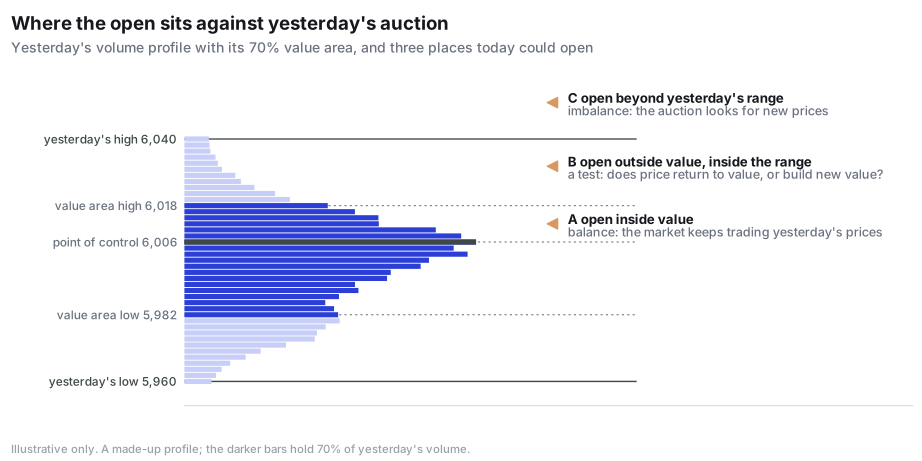
- Inside value. The market opens among yesterday's accepted prices. Nothing has been rejected yet, and balance is the default until price leaves value with conviction. Edges of value tend to be references for both sides.
- Outside value, inside yesterday's range. The open asks a question. If price returns into value and stays, yesterday's agreement still holds. If it holds outside and builds new volume there, value is moving.
- Beyond yesterday's range. The market is looking for prices it has not traded recently. The first test is whether it is accepted out there or pulled back into the old range quickly. A fast return is information; so is a session that never looks back.
The first minutes then tell you what kind of open it is. Four patterns cover most sessions:
- Open drive. Price leaves the open at once and never comes back. A big move is not by itself a reason to bet against it; what weakens it is price coming back to the open.
- Open test drive. Price first tests a nearby reference, then drives the other way through the open. The tested extreme becomes the line that should not break.
- Open rejection reverse. An early move fails and price comes back through the open. It still needs to prove itself on a retest.
- Open auction. Price rotates around the open without going anywhere. Inside value, the edges of value are the places to watch; outside it, watch whether price builds a new area or drifts back to the old one.
Keep the first 15 minutes and the first hour as separate references: the first is an early read, the second is the session's initial balance. Use the opening price itself as the day's main pivot. After that, four questions at each completed bar keep the reading honest: which way is the market trying to go, what volume comes with it, where is today's value forming, and what shape is the profile taking? A long, thin profile is a trending day; a fat one with rotations is balance. A bulge near the high after a rally can be short covering, and one near the low after a fall can be long liquidation. Thin, low-volume stretches between two heavy areas are where price can travel fast.
The key word in all three is acceptance. A single trade at a level is a touch. Acceptance is time and volume beyond it: price staying there and building a profile of its own. A touch tells you price can get somewhere; acceptance tells you the market is willing to do business there, which changes what the next references are. A tail on the profile, prices visited briefly and left, is the classic mark of rejection; a long candle wick is not the same thing. And being near the point of control is not a reason to enter: the point of control is more often a destination than a starting point. The same idea applies to every level on any map, as covered in Call Walls and Gamma Flips Are Not Odds.
Value is not only a daily idea. Last week's and last month's value areas show where larger participants agreed on price, and a daily level that sits on one of them carries more weight than one standing alone in a gap. Anchored VWAP gives a second view of the same question, explained in Anchored VWAP and Liquidity.
Volume is not liquidity: volume, open interest and what they say together
Volume counts contracts traded. It does not say how easy it is to trade. A session can be busy because one side is in a hurry, which makes the market thinner, not deeper. The better guide to liquidity is volatility: where liquidity is deep, price moves slowly; where it is thin, price travels fast. Volume also drops ahead of major data, when traders wait.
Open interest is the number of contracts still open at the end of the day. Read with volume, it tells you what kind of trading happened:
| Volume | Open interest | What it usually means |
|---|---|---|
| Up | Up | New positions are being opened |
| Up | Down | Positions are being closed: covering or liquidation |
The most useful warning is volume without progress. If volume jumps but neither price nor volatility moves much, the heavy trading is usually someone absorbing the other side, not the start of a trend.
The index has no volume
The S&P 500 index is a calculation from 500 stock prices. Nobody trades it directly, so it has no volume. When an SPX chart shows volume bars, they are borrowed from somewhere, usually the futures.
Whether borrowing works depends on the question. Measures that only need to know where volume traded, such as a volume profile or VWAP, carry over well, because ES and the index move almost tick for tick inside a minute. Measures that need to know who was the aggressor, buyers lifting offers or sellers hitting bids, do not. That is what delta and cumulative delta measure, and only the traded contract has an answer. Assigning ES volume to the index's own price ticks gives the wrong side often enough to flip a session's net delta.
Even on the real contract, delta needs care. A minute's side is often decided by a single tick, and two data feeds can disagree by that one tick. In our own comparisons, a session's net delta inside about 2% of its volume could change sign between feeds. Treat a small net delta as even, and read delta on ES itself, never on the index.
Where options positioning meets the futures tape
A large share of the hedging behind SPX options takes place in ES. When dealers are long gamma, their hedging tends to sell rallies and buy dips, leaning against moves. When they are short gamma, it tends to add to moves. Same-day options sharpen this into the afternoon, which is part of why the last hour's volume is so heavy. For more on how gamma maps are read and misread, see Gamma Exposure and 0DTE Pins.
So a futures trader works with two maps of the same market. The options map is written before the open: where positioning may slow price down, where it may let it run, and what the options market prices for the odds of getting there. The auction is written during the session: where volume is building, whether a level is touched or accepted, and whether volume behind a move is heavy or light for the time of day.
The useful readings come from comparing them. A level from the options map that sits on yesterday's point of control is saying the same thing twice. A level that sits alone in a low-volume gap is untested. And when price is accepted beyond a level that positioning expected to hold, the tape is telling you something the morning map did not know.
Executing and sizing the trade
A plan only matters if the order carries it out. A few habits do most of the work:
- Size from the worst fill you will accept. If an entry order can fill anywhere within a small price range, use the worst price in that range to decide the size. A better fill afterwards does not justify a bigger order beforehand.
- Know what your stop is. A stop order becomes a market order when it triggers and will fill, possibly at a worse price. A stop-limit order controls the price but may not fill at all in a fast market.
- Place the protection with the entry, as a bracket, and check after every fill that the position and the working orders match. An order is only gone once the broker confirms it, and a day order that lapses at the close leaves any open position exactly where it was.
- Choose the exit before the entry. A trailing stop and a fixed stop held to the close turn the same move into very different results. Deciding afterwards which one you meant is not a plan.
- Decide in advance what you do around major releases: be flat before them, and know whether you trade the first minutes after or wait for the dust to settle.
- Set a risk budget and keep it. A fixed amount you are willing to lose per idea, a daily loss limit of a few of those, a limit on attempts per setup, and smaller size after two losing trades in a row. A stop is never widened once the trade is on.
The arithmetic of a futures rule
A rule for trading ES has two numbers that matter, and a hit rate is only half of one. With a fixed target and a fixed stop, the hit rate needed to break even after costs is:
break-even hit rate = (stop + costs) / (target + stop), all in points
With an 8-point target, an 8-point stop and 0.6 points of costs per trade (fees plus slippage on the stops), break-even is about 54%, not 50%. Costs that look small per trade take a real share of a short-target rule.
A wider target does not fix this. It lowers the hit rate needed to break even, but it also lowers the chance of reaching the target, and the costs are still there at every distance. A good-looking reward to risk ratio is a filter, not an advantage.
The second number is how much you actually know. A hit rate measured on a handful of trades is mostly luck. Take a rule that has won 60% of its trades, comfortably above that 54% break-even, and ask how far its true hit rate could still be from 60% at different sample sizes:
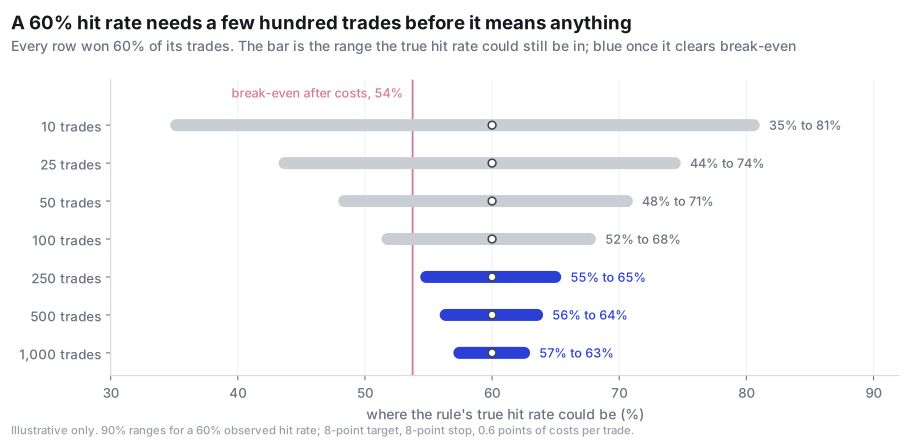
After 10 trades, the true hit rate could be anywhere from the mid-thirties to about 80%. After 100, it still cannot be told apart from break-even. Only somewhere past 200 trades does the range clear it. That is why the rule has to be written down before the trades, every trade has to be counted including the skipped and the ugly ones, and the verdict should come from the result after costs rather than from how often it felt right.
Two more checks keep a rule honest. Profits are usually concentrated in a handful of trades, so a short run of results says little and a filter that removes a few "ugly" trades can remove the ones that paid for everything. And every number in a rule is a choice: a buffer, a time window, a lookback. Move each one a step either way. A rule that only works at its exact settings has been fitted to the past.
Written rules give structure; they do not replace judgment. Experience lets a trader skip a setup that does not fit the day, enter earlier on a clear risk point, or keep part of a winner running. Some lines stay fixed whatever the read: no trade without a stop chosen in advance, no wider stop once the trade is on, and no change to the plan after a loss. When you do step outside the rules, note it before the order goes in. After a few months, those notes show whether your own calls helped or hurt.
Eight questions before a futures session
- Which contract am I trading, and is my chart showing that contract or a continuous series near a roll?
- Where is the index implied to be, using fair value rather than yesterday's closing gap?
- Where is yesterday's value, and will the open be inside it, outside it, or beyond the range?
- Which overnight levels were made on thin volume, and which were made in the full market?
- What does the options map expect, where might hedging slow price and where might it let it run, and what are the odds of reaching each level?
- Have I written the plan: the likely test, the alternative, and what proves each wrong?
- What is my stop in points, what does it cost per contract, and is ES or MES the right size for it?
- What would acceptance look like at the levels that matter today, and what changes if it happens?
How morphic approaches it
Before each session morphic publishes one map of the day ahead for SPX and ES. On the ES chart the numbers are ES's own: yesterday's value area and point of control, last week's and last month's value, the overnight range, today's value as it builds, and relative volume for the time of day, next to the day's options levels with their odds shown at ES prices. The market odds and the positioning odds are always labelled, and the map is not redrawn once the session starts. morphic provides market-structure commentary, not trade calls or investment advice.
Frequently asked questions
How much is one point on ES worth?
One full point on the E-mini S&P 500 is $50, and the minimum tick of 0.25 points is $12.50. On the Micro E-mini, MES, one point is $5 and a tick is $1.25.
Why is ES higher than the SPX?
The future carries interest minus dividends until expiry, its fair value premium. With rates above the dividend yield, ES trades above the index, and the premium shrinks to zero as expiry approaches.
How do I know where the SPX will open from overnight futures?
Subtract fair value from the current ES price to get the index level the futures imply, then compare it with yesterday's close. The gap between yesterday's closing prints is a rougher guide, because the two closes are not one simultaneous snapshot.
What are ES futures trading hours?
ES trades from 18:00 New York time on Sunday to 17:00 on Friday, with a daily break from 17:00 to 18:00 and a short halt after the cash close. Most of the volume trades between 09:30 and 16:00.
When do ES futures roll?
Contracts expire on the third Friday of March, June, September and December. CME lists the Monday of expiration week as the roll date, and most volume moves to the next quarter in the days around it.
Should I trade ES or MES?
That depends on the stop and the amount you are willing to risk. MES is one tenth of ES, so it lets you size a position to the distance of the stop instead of rounding to one large contract or none.
Are futures linear or non-linear?
Mostly linear, with a small convexity. Each point of price movement is worth the same amount, but daily settlement means gains and losses earn or cost interest, and because rates move with the market that adds a slight curve. Options are non-linear: their exposure changes as price moves. That is why options dealers keep adjusting their hedges, usually in futures.
What happens on a futures margin call?
Futures gains and losses are settled every day. If the account falls below the maintenance margin, the broker asks for enough money to bring it back to the initial margin, not just to the maintenance level, or closes the position.
What is a value area in futures trading?
It is the range of prices that held 70% of a session's volume, around the point of control, the price with the most volume. It shows where the market agreed to do business, and the open's position against yesterday's value frames the first hour.
Can I read delta or order flow on the SPX index?
No. The index has no volume and no aggressor. Volume at a price can be borrowed from futures for a profile or VWAP, but delta should be read on the traded contract itself.
Sources and further reading
- CME Group, E-mini S&P 500 futures contract specs
- CME Group, Micro E-mini S&P 500 futures contract specs
- CME Group, Equity index roll dates
- CME Group, Understanding futures expiration and contract roll
- Hull, J. C., Options, Futures, and Other Derivatives: the cost-of-carry pricing of stock index futures
- Dalton, J. F., Jones, E. T. and Dalton, R. B., Mind Over Markets: market profile, value areas and the auction
This article is educational and describes general market concepts. It is not investment advice or a recommendation to buy or sell any security or contract. Futures and options trading carries a substantial risk of loss, including losses larger than the money deposited. All levels and figures are made up for illustration except the measured volume shares, which describe past sessions and may not hold in the future.
More from the blog
Call Walls and Gamma Flips Are Not Odds: What SPX Levels Leave Out
A call wall or gamma flip is a checkpoint, not a destination. How to read SPX levels through their odds, the volume profile, the clock and acceptance.
 Ofri B.Nov 4, 2026 · 17 min read
Gamma Exposure and 0DTE Pins: Why One Number Misreads the Day
One gamma exposure number hides the day. The gamma flip, positive vs negative gamma, pins vs max pain, and why 0DTE gamma sharpens into the close.
Dor S.Oct 26, 2026 · 12 min readAnchored VWAP and Liquidity: How to Read Where SPX and ES Agreed on Value
Learn how anchored VWAP (AVWAP) maps liquidity on ES and SPX: formulas, anchor selection, volatility, four readings and what options add.
Dor S.Oct 20, 2026 · 13 min read