Call Walls and Gamma Flips Are Not Odds: What SPX Levels Leave Out
A call wall or gamma flip is a checkpoint, not a destination. How to read SPX levels through their odds, the volume profile, the clock and acceptance.
Key takeaways
- A gamma level is a checkpoint, not a destination and not an automatic turning point. A gamma flip, call wall or put wall says where hedging may change, not how likely the SPX is to get there. The same level 40 points away can have about a 50% chance of a touch on one day and under 1% on another.
- A call wall or put wall is usually just the largest gamma bar. Its sign is assumed, its size says little alone, and it carries no odds, yet it is often sold as inside knowledge.
- A vanna flip is a different kind of level: it marks where the hedging response to rising volatility can reverse, not where a lot of gamma sits.
- A level only means something with five answers around it: its odds, what volatility tends to do there, where it sits on the volume profile, what the clock does to it, and what it becomes if price is accepted beyond it.
- A touch, acceptance and a close are three different events. If a touch is always twice as likely as a close, half of all touches come back at every level, so that rule alone cannot tell you which level holds.
- Positioning comes first and hedging second, and the tape is the test. When volatility behaves differently at a level than the structure expected, that difference is information about where liquidity has gone.
The question a level does not answer
Most SPX key level reports look alike: a gamma flip, a call wall, a put wall, perhaps a pin or two. The report tells you that 6,040 matters. A trader looking at it wants to know something else: is the SPX going to 6,040 today, and what happens if it does?
The level cannot answer that on its own. Providers of gamma data say so themselves. SpotGamma writes that gamma exposure "does not predict direction" and that its levels are "not guaranteed support, resistance, pins, or breakout triggers". FlashAlpha notes that the calculation "does not observe actual dealer inventory". Those are fair warnings about what the number is. They also leave the trader's question open.
The result is two common mistakes. The first treats a level as a destination because it is printed on a map, so a call wall becomes a target. The second treats it as a turning point, so a put wall becomes a floor. A more useful way to hold a level is as a checkpoint: a place where you learn something about the session by watching what happens there.
What SPX gamma levels really are: the trace of a bet
Popular explanations make dealers sound like the hidden hand behind every move. The order is closer to the opposite. Customers place positions where they expect calm or movement. Dealers take the other side and hedge. That hedging can then reinforce what customers priced in, as long as the session unfolds in a way that fits the positions. Read this way, a gamma map is a picture of expectations first and of mechanics second.
Three terms carry most of the weight in any gamma report:
- Gamma flip. The modeled price where dealers' net gamma changes sign. On the positive side, their hedging tends to lean against moves. On the negative side, it tends to add to them.
- Call wall. A large modeled concentration of call gamma above the market, often read as resistance.
- Put wall. A large modeled concentration of put gamma below the market, often read as support.
Each one describes the possible character of a price, and volatility is the plainest way to see it. Volatility is an inverse measure of liquidity: where liquidity is deep, price moves slowly and spends time; where it is shallow, price travels quickly. Two cautions follow. The size of a gamma bar alone says little, because what matters is how it compares with the gamma around it and at the current price. And hedging only matters relative to the market it trades in: a flow that looks large on a chart can be small next to the depth of S&P futures. For more on how a single gamma number can mislead, see Gamma Exposure and 0DTE Pins.
Why call walls and put walls mean less than they look
A call wall or put wall is usually just the largest gamma bar on one side of the map. It is a real fact about open positions. As a statement about what price will do, it carries far less weight than the name suggests, for five reasons.
- The sign is assumed. Open interest shows how many contracts exist, not who owns them. Common wall calculations assume dealers are long the calls and short the puts, which FlashAlpha describes as "an assumption, not observed dealer inventory". If customers bought those calls instead, the same bar means dealers are short gamma there, and hedging adds to a rally rather than leaning against it. Same bar, opposite reading.
- Size alone says little. A bar only means something next to its neighbours and next to the gamma at the current price. The more important price is often where hedging is weakest, because that is where a move can travel.
- Expiries get mixed. A wall summed across expiries blends options that expire today with options that expire weeks away. They do not hedge alike, so the largest bar on the chart may have little to do with today's session.
- Hedging has to be large relative to the market. A bar can look enormous on a chart and still be small next to the depth of S&P futures and the orders arriving that day.
- It has no odds and no clock. A wall does not say how likely a visit is, or whether the level matters in the morning, the afternoon or not at all.
None of this makes positioning data useless. It makes one line a poor summary of it.
How call walls and put walls got oversold
Options hedging reached a wide retail audience during the 2021 GameStop squeeze. The idea that option positions can move the underlying spread quickly, and a small industry grew up around selling it. Finance influencers, often called furus, found that dealer flows could explain almost any move after the fact. Market makers were recast as puppet masters, and anyone claiming to have been one had a ready audience.
Walls suit that business well:
- They are easy to sell. One number with an institutional name feels like inside knowledge, and it fits in a morning post.
- Jargon stands in for evidence. Vanna, skew and opex flows, used in ever more elaborate stories, sound expert and are hard for a buyer to check.
- They are hard to prove wrong. If the level holds, the wall worked. If it breaks, dealers got squeezed. With no odds written down in advance, neither outcome can count against the call.
- The hits get the screenshots. A line drawn near a turn gets posted, and the lines that did nothing are forgotten. A claimed hit rate says little in any case, because it ignores what the wins paid and what the losses cost.
The cost falls on the reader. Positioning data is useful, and giving it a meaning it cannot support is the quickest way to make it useless. Careful data providers do warn about this, as the quotes above show; the problem is how the line gets repeated. The same test applies to anyone selling levels, us included: ask the six questions at the end of this article.
What is a vanna flip? A different kind of level
Gamma describes how hedging responds to price. Vanna describes how it responds to implied volatility: how much an option's delta changes when implied volatility moves. A vanna flip is the price where dealers' net vanna changes sign.
That makes it a different kind of level from a wall. On one side of the flip, a rise in implied volatility pushes dealers to sell; on the other, it pushes them to buy. So the hedging flow can reverse at the flip itself, and it can do so just as volatility is rising, when it matters most. A wall says where a lot of gamma sits. A vanna flip says where the direction of the response changes, which is often the more useful thing to know.
It still needs the same caution as any other level:
- Flips are not all alike. Some tend to turn a move back as volatility rises, while others help it carry on.
- It moves. The flip shifts as implied volatility changes, so it is a zone to watch rather than a fixed line.
- One summed number is crude. Implied volatility moves differently across expiries, and dealers manage vega by maturity rather than as one total. A single vanna figure added up across every expiry hides that.
- It has limits. A large enough jump in volatility overwhelms it, as it does every other level.
Where SPX odds come from: market odds and positioning odds
The odds live somewhere else: in option prices. The prices of SPX options across strikes imply a full set of probabilities for where the index closes at expiry, a result that goes back to Breeden and Litzenberger in 1978. These are the market odds.
They are what the market charges, not a forecast, because they include the premium investors pay for protection. And paying them gets you no advantage by itself, because the price of the bet already is those odds. They are the fair starting point for a question about a level, not the final answer.
A second question sits beside them: given the positions the crowd actually holds, which outcomes is it a bet on? Those are the positioning odds. They show what the crowd needs to happen, which is not the same as what will happen. The two should never be blended into one number, because the distance between them is part of the reading.
One SPX level, four different days
Take an SPX level 40 points above the market. Nothing about it changes in the chart below. Only the implied move left to the close changes, either because the day is calmer or because the session is further along.
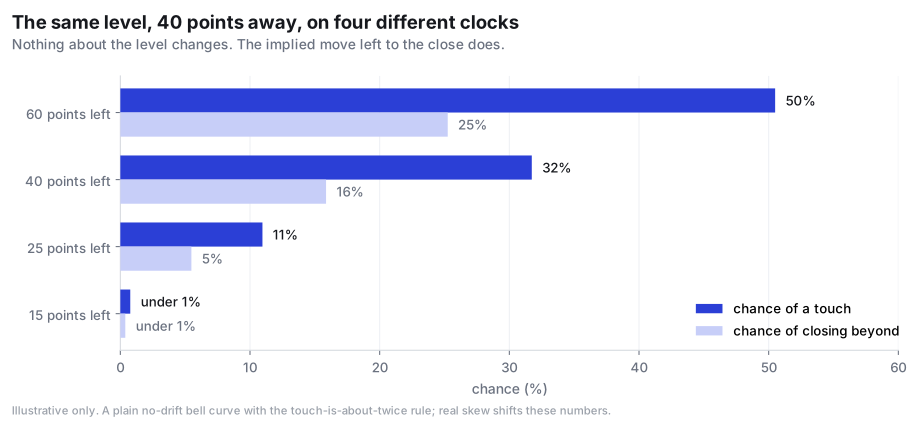
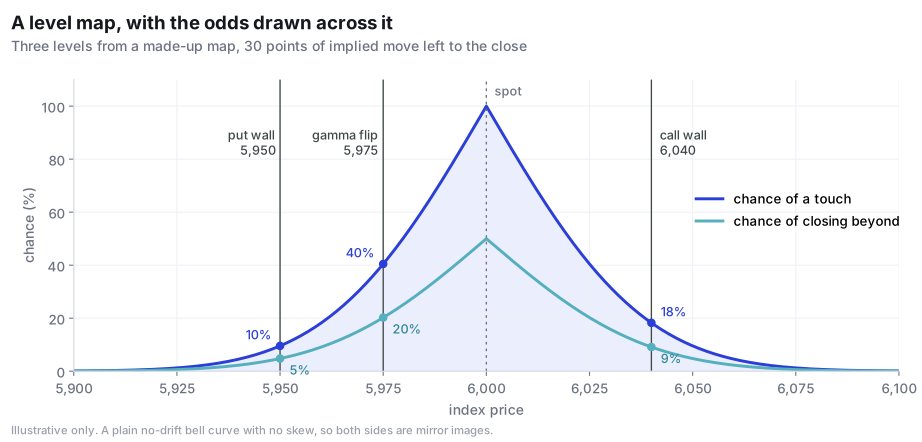
A report that lists the level without the odds shows all four of these days identically. On the first, the level is close to a coin flip for a touch. On the last, it has little to do with the session. Drawn across a made-up map, three levels look far less equal once each has its numbers.
Touch, acceptance and close: three different events
"Will it get there?" is really three questions. A touch counts any trade at the level. A close beyond counts only where the index finishes. Between them sits the event that often decides the day: acceptance, when price stops merely visiting a level and trades beyond it for a sustained period.
The rule of thumb says a touch is about twice as likely as a close beyond, as covered in Probability of Touch vs Probability of Expiring In the Money. Follow that arithmetic one step further. If a touch is always twice a close, then half of all touches come back, at every level, every day. So the plain rule can give the odds of a visit, but it cannot separate a level that tends to hold from one that tends to give way. That has to come from something else: the positions, the auction and the behaviour of the tape.
Acceptance also changes what a level is. The same price can be a line that pulls the index back while it is only being probed, and a stepping stone once price has been accepted beyond it. From then on, the next references in that direction become the ones that matter, and fading the old level is a different trade from the one it was an hour earlier.
How price arrives matters too. The same level can mean different things after a sharp, fast run than after a slow grind. A move that reaches a level too quickly can raise the odds of a quick rebalance. A slow approach that builds structure as it goes says something else.
Where the level sits on the volume profile
Options positioning is one map. The auction is another: where trading has actually concentrated, shown by a volume profile and its value area. Price tends to slow and spend time on high-volume shelves, and to travel quickly through low-volume gaps. A level gains or loses meaning depending on which of these it lands on, and on which timeframe that shelf or gap belongs to: yesterday, last week or the month. For another way to see where the market agreed on value, see Anchored VWAP and Liquidity.
So the useful question is whether the maps agree. A gamma level that sits on a heavy shelf is telling you the same thing twice. A gamma level alone in a gap, with no history of trade around it, is untested price discovery. Here are two made-up levels with the same market odds, an 18% chance of a touch and a 9% chance of a close beyond:
- Level A, on a shelf. It sits inside last week's value area on a high-volume node, hedging there absorbs volatility about as well as at the current price, and that support grows into the afternoon. A probe is more likely to stall, and the thing to watch is whether it stays a probe.
- Level B, in a gap. It sits above the value area in a low-volume gap, hedging there adds to moves, and little trade has happened nearby. A visit is just as likely, but if price is accepted there it may travel fast to the next reference.
A list of levels shows these two as the same line. They are very different prices to be near.
What the 0DTE clock does to a level
Time changes a level in two ways. The first is the odds, as the chart above shows. The second is its character. Same-day gamma sharpens into the close, so a level with little effect in the morning can become sticky in the last hours, while another fades. Time decay also creates hedging flow on its own, which can pull the index toward some prices and push it away from others without any change in the positions. The morning and the afternoon can point in different directions, so a level's reading should come with a time of day attached.
Reading the tape: realized volatility is the test
All of this is an expectation, written down before the session. The tape then tests it, and realized volatility is the first thing to check. Did volatility compress where the structure said it should expand? Did it expand where the structure said it should absorb? Either result means liquidity did not appear where the market expected, and a persistent difference suggests the market is repricing what it had priced in. That is useful even when no level has been reached.
The mechanics also have limits. A moderate rise in volatility can be absorbed, but a large enough shock overrides positioning altogether. News, large orders and positions in other expiries can all carry the index through any level.
Does gamma exposure predict volatility? What the research says
The character of a level deserves some caution, because the evidence is mixed. A study by Adams and co-authors, as summarized by Quantpedia, finds that changes in market makers' net gamma predict lower S&P 500 volatility over the next 10 minutes, with the effect fading after about an hour. Cboe, which operates the market and so has an interest in the question, argued in 2023 that potential hedging flows from same-day options were only 0.04% to 0.17% of daily S&P futures liquidity.
A fair summary is that hedging can matter, that the effect may be brief, and that its size depends on the depth around it. Any report that presents gamma as certainty is claiming more than the research supports.
High odds are not a good trade
Odds complete the picture of a level, but they do not turn it into a decision. A 70% chance of something is worth little if the 30% costs more than the 70% pays, and a 40% chance can be worth a lot if the reverse is true. What matters is the expected result after costs, the size of the bad outcome and the position size, not how often you are right. That is why odds belong in a plan written before the session, with each level's meaning decided in advance, rather than in a reaction made when price arrives.
Six questions to ask of any SPX levels report
- What are the odds? If the report gives no chance of a touch and of a close beyond, you know where the level is but not whether it is in play.
- Whose odds are they, and what do they assume? The options market's own, the positioning odds, or someone's model? Each should be labelled, and any level should say what it assumes about who holds the positions.
- What should volatility do there? Absorb or expand, compared with the current price, and how would you know if it did not?
- Where does it sit on the volume profile? On a shelf or in a gap, inside the value area or outside it, and from which timeframe?
- What does the clock do to it? How much time do the odds assume, and is this a morning level, an afternoon level or both?
- What does it become if price is accepted beyond it, and was it written down in advance? A map published before the open can be checked against the day. A map redrawn during the session is hard to hold to anything.
How morphic approaches it
Before each session morphic publishes one map of the day ahead for SPX and ES: the levels that matter with the odds on each, read alongside the volatility profile and the auction behind them. The market odds and the positioning odds are always labelled, and the map is not redrawn once the session starts. morphic provides market-structure commentary, not trade calls or investment advice.
Frequently asked questions
Is a gamma level a probability?
No. A gamma level marks where hedging may change, such as the gamma flip or a call wall. It says nothing by itself about how likely the index is to reach that price. The odds come from option prices.
What are the odds SPX reaches the call wall today?
It depends on how far away the call wall is and how much implied move is left to the close. In a simple example, a level 40 points away has about a 50% chance of a touch with 60 points of implied move left and about 11% with 25 points left.
Is the gamma flip support or resistance?
Not automatically. The gamma flip is the modeled price where dealers' net gamma changes sign, so it describes a possible change in how moves behave. The index can pass through it, and it can shift during the day.
Do call walls and put walls actually work?
They are modeled concentrations of gamma, not barriers. The calculation usually assumes who owns the positions, the size of a bar says little on its own, and it comes with no odds. News, large orders or a large rise in volatility can carry the index through them.
What is a vanna flip?
A vanna flip is the price where dealers' net vanna changes sign. On one side, a rise in implied volatility pushes dealers to sell; on the other, it pushes them to buy. So the hedging flow can reverse there, though a large jump in volatility can overwhelm it.
What is the difference between a touch, acceptance and a close beyond a level?
A touch counts any trade at the level. Acceptance means price trades beyond the level for a sustained period rather than just visiting it. A close beyond counts only where the index finishes.
If a level gets touched, how likely is it to come back?
Under the plain rule that a touch is twice as likely as a close beyond, half of all touches come back at every level. Real levels differ from that, which is why positions, the auction and the behaviour of volatility at the level matter.
Sources and further reading
- Breeden, D. T. and Litzenberger, R. H. (1978), Prices of State-Contingent Claims Implicit in Option Prices, The Journal of Business
- Adams, G. et al., Do S&P500 Options Increase Market Volatility? Evidence from 0DTEs, as summarized by Quantpedia
- Xu, M. (2023), Volatility Insights: Much Ado About 0DTEs, Evaluating the Market Impact of SPX 0DTE Options, Cboe
- Dalton, J. F., Jones, E. T. and Dalton, R. B., Mind Over Markets: how to read the auction through market profile
- SpotGamma, Gamma Exposure (GEX): what gamma exposure does and does not show
- FlashAlpha, What Is Gamma Exposure (GEX)?: the assumptions behind dealer position estimates
This article is educational and describes general market concepts. It is not investment advice or a recommendation to buy or sell any security or contract. Options and futures trading, including 0DTE trading, carries a substantial risk of loss. All levels and figures are made up for illustration.
More from the blog
Gamma Exposure and 0DTE Pins: Why One Number Misreads the Day
One gamma exposure number hides the day. The gamma flip, positive vs negative gamma, pins vs max pain, and why 0DTE gamma sharpens into the close.
 Dor S.Oct 26, 2026 · 12 min read
Anchored VWAP and Liquidity: How to Read Where SPX and ES Agreed on Value
Learn how anchored VWAP (AVWAP) maps liquidity on ES and SPX: formulas, anchor selection, volatility, four readings and what options add.
Dor S.Oct 20, 2026 · 13 min readProbability of Touch vs Probability of Expiring In the Money: What SPX 0DTE Traders Get Wrong
Probability of touch is about 2x the odds of finishing in the money. The math, SPX 0DTE tables, the skew catch, and stops and targets.
Ofri B.Oct 20, 2026 · 13 min read